Cashflow
Income up, expense down, the zero line tells the story.
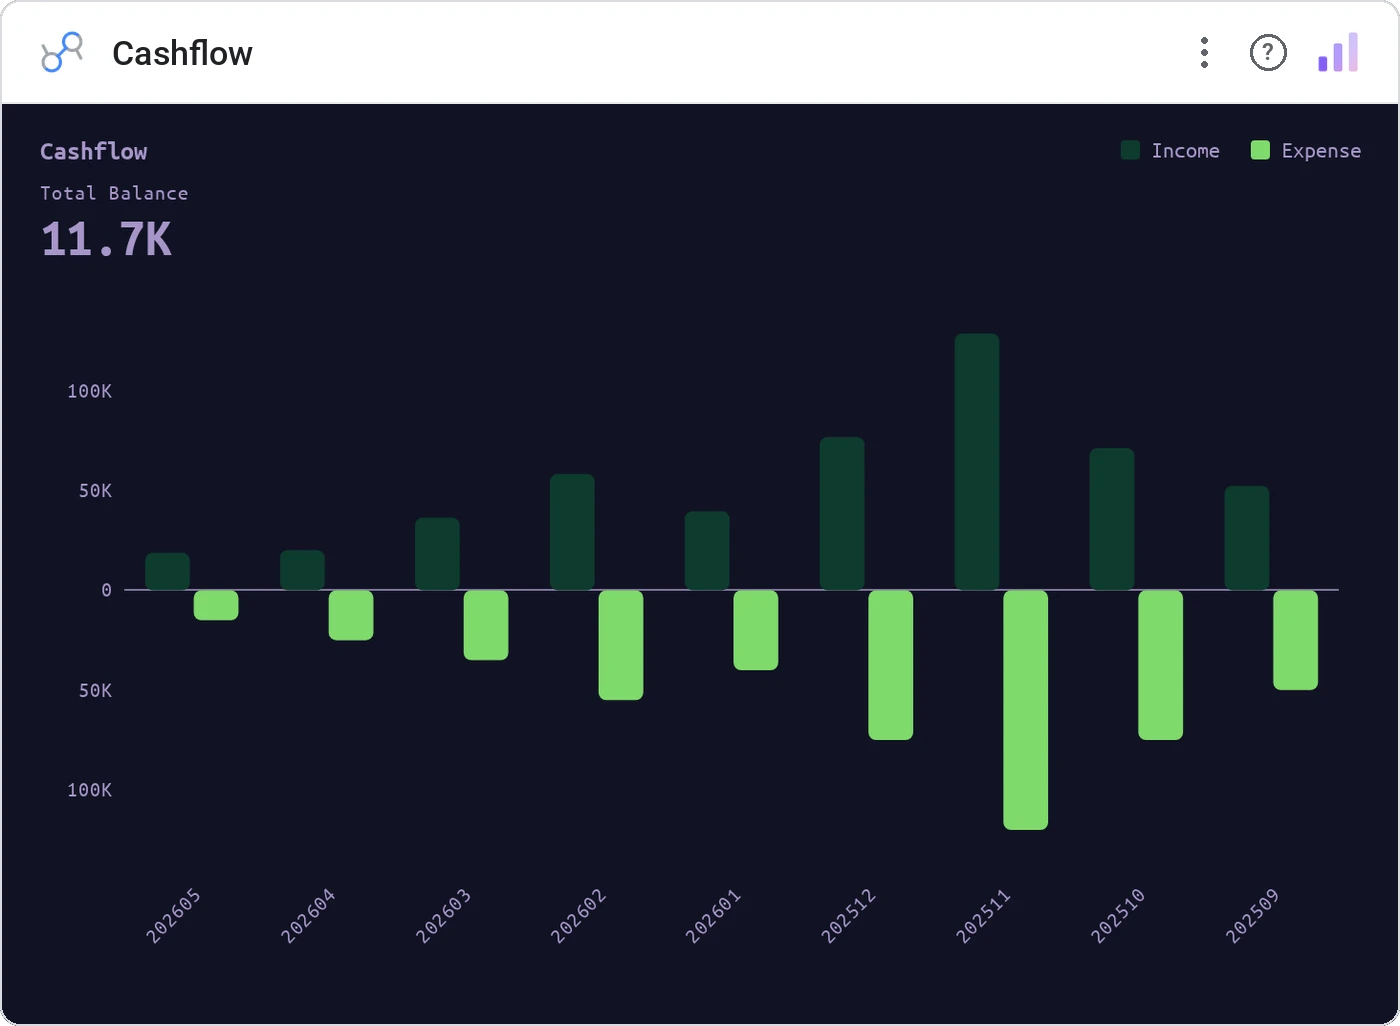
Cashflow is a mirror bar chart: income bars rise above the baseline, expenses drop below. A bold KPI header sums the net balance, theme-aware colors keep the canvas clean, and label-fit logic handles dense monthly time axes automatically.
Mirror bars around a zero baseline for one period dimension and two metrics (Income, Expense). Includes net-balance KPI header, legend, tooltip, cross-filter, theme-aware colors, compact number formatting.
Net cashflow narratives need both the magnitude and the polarity in one read. A mirror bar gives both, plus the implicit "are we in the black?" via the zero line.
Three ways teams use it.
Monthly P&L: revenue up, opex down, net delta at top.
Bookings vs refunds across quarters.
Income vs expense for budgeting dashboards.
Add it in 30 seconds.
Open your Data Studio report and click Add a chart → Community visualizations → Explore more.
Paste the Viz Studio manifest URL or pick this chart from the Viz Studio gallery card.
Bind the dimensions and metrics in the data panel. Done.
More from Finance & Performance
All 75+ charts →Included in your vizstudio plan.
One plan, everything in it: the full library of 75+ charts. No per-seat upcharges, no metering. Build a real dashboard before you pay a cent.
Start free →