Small Multiples / Trellis Grid
Small multiples, the same chart, repeated, every dimension visible.
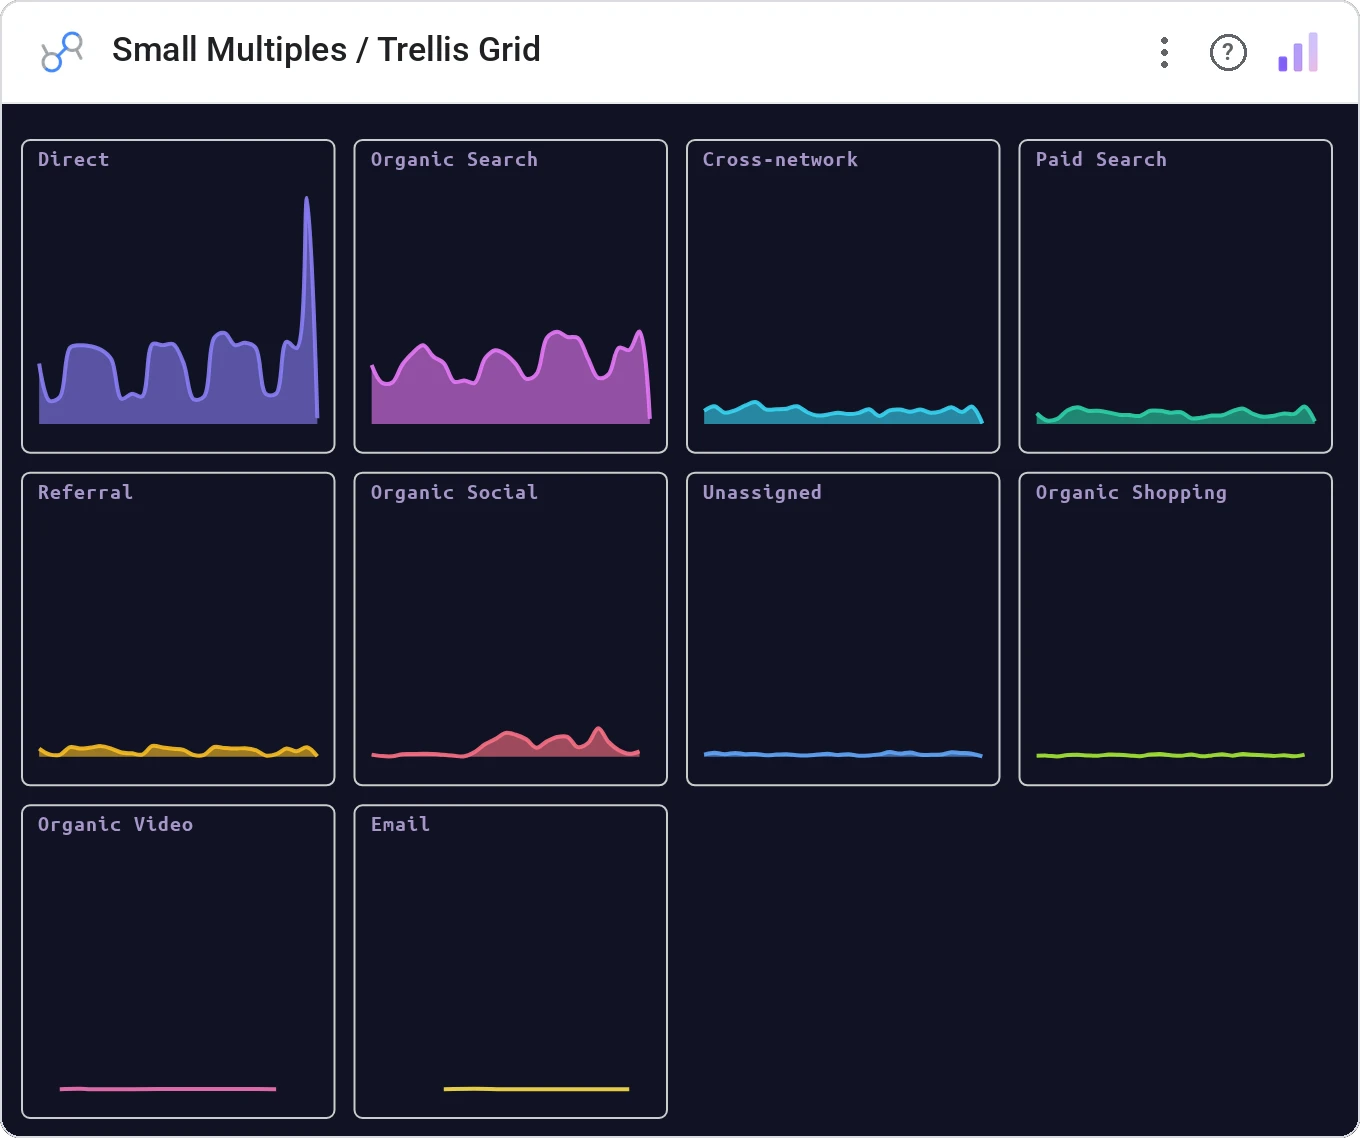
Small Multiples / Trellis Grid breaks one big chart into a grid of small charts, one per category, sharing axes. The Tufte-blessed way to compare a pattern across N segments in a single image.
Grid of identical small charts (line, bar, area, scatter), one per category, with shared axes, free or fixed scale, common tooltip.
Stacking 12 series on one line chart is unreadable. Splitting them into 12 small charts is honest.
Three ways teams use it.
Channel performance over time, one mini-chart per channel.
Cohort retention per cohort.
Pipeline progression per region.
Add it in 30 seconds.
Open your Data Studio report and click Add a chart → Community visualizations → Explore more.
Paste the Viz Studio manifest URL or pick this chart from the Viz Studio gallery card.
Bind the dimensions and metrics in the data panel. Done.
Included in your vizstudio plan.
One plan, everything in it: the full library of 75+ charts. No per-seat upcharges, no metering. Build a real dashboard before you pay a cent.
Start free →