Wind Rose / Polar Bar
Polar bars: magnitude by direction, distribution by angle.
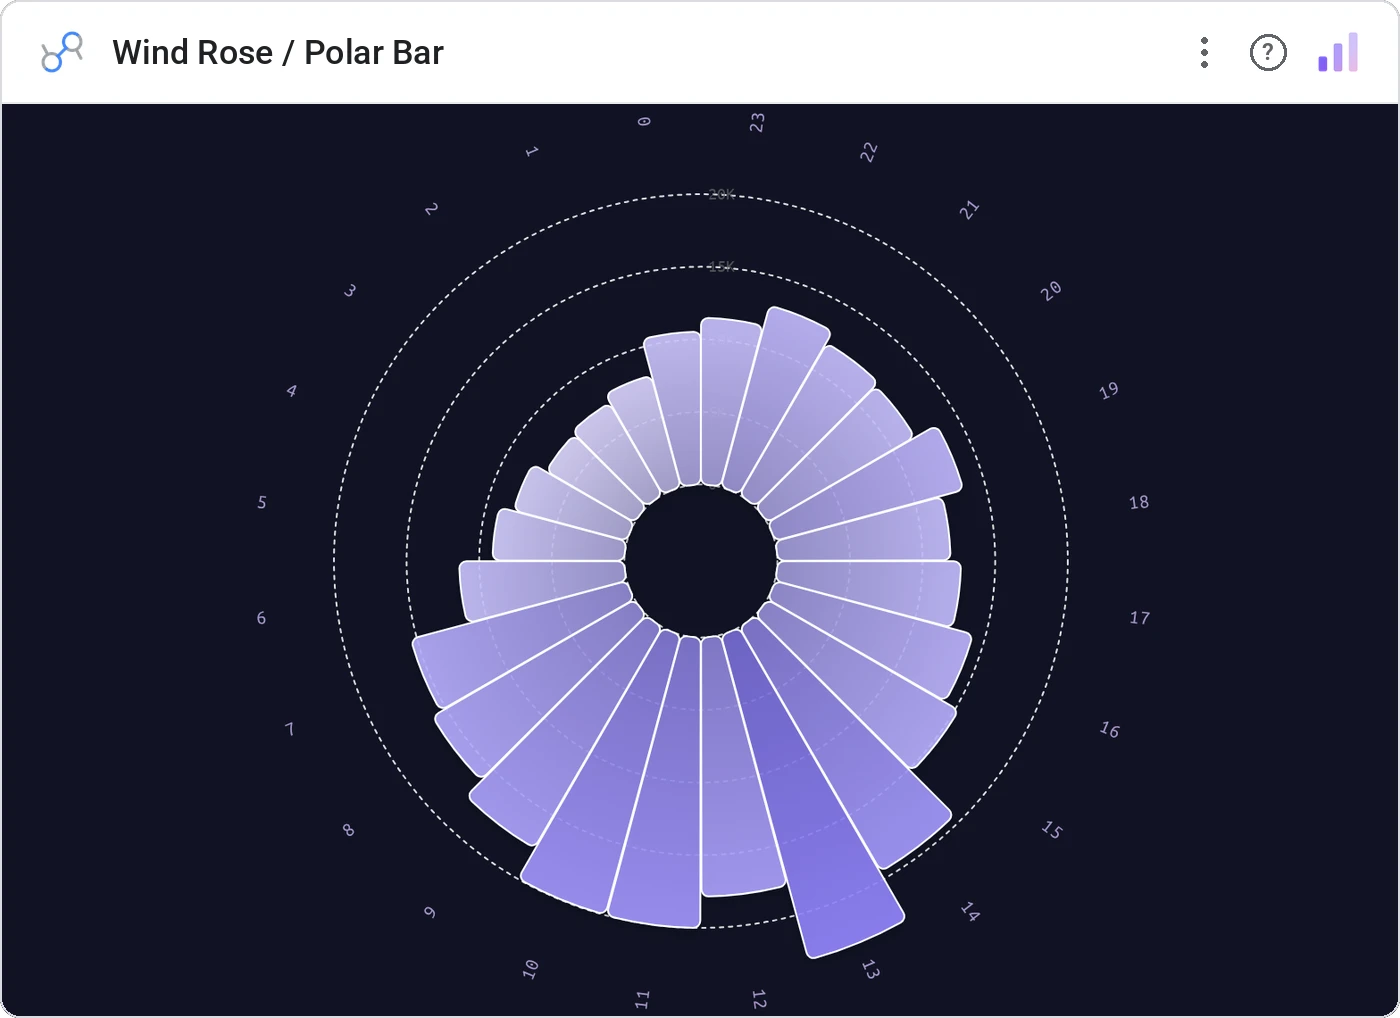
Wind Rose / Polar Bar arrays category bars around 360° instead of along a baseline. Built for directional data (wind, time-of-day, compass) but useful anywhere magnitude has a natural angular axis.
Polar bars at angles per category with bar length = magnitude, optional stacked segments, tooltip, theme color.
Directional data on a linear axis loses its meaning; polar layout preserves it.
Three ways teams use it.
Wind speed and direction.
Inbound passenger by origin compass bearing.
Engagement by hour-of-day around the clock.
Add it in 30 seconds.
Open your Data Studio report and click Add a chart → Community visualizations → Explore more.
Paste the Viz Studio manifest URL or pick this chart from the Viz Studio gallery card.
Bind the dimensions and metrics in the data panel. Done.
More from Bars, Columns & Ranking
All 75+ charts →CI bars for A/B variants: significance baked in.
The animated bar chart race that wins every monthly review.
Animated curved columns: bars that arc to draw the eye.
Curved columns, static, the still-frame version with the same elegance.
Included in your vizstudio plan.
One plan, everything in it: the full library of 75+ charts. No per-seat upcharges, no metering. Build a real dashboard before you pay a cent.
Start free →