Radar Chart with Data Table
Radar chart with a sibling data table: visual and exact.
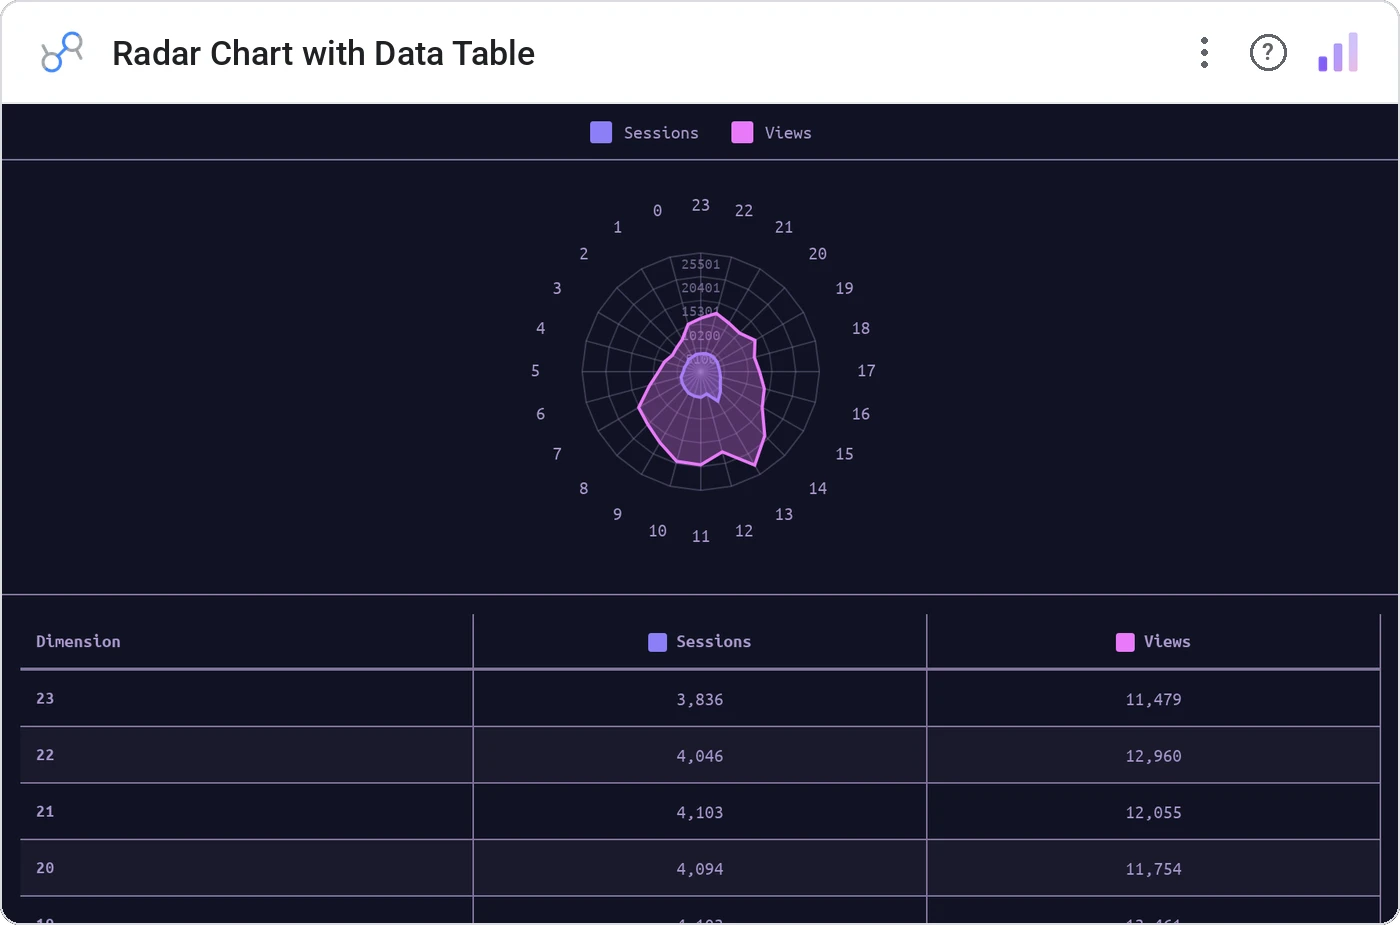
Radar Chart with Data Table pairs a polygon radar across N metrics with a sortable table of the underlying values. The radar tells the shape story; the table answers "what was the exact number?" without a second view.
Radar polygon per category over shared metric axes, alongside a sortable data table with the values, theme-aware coloring.
Radar charts are good at shape, bad at precision. Adding the table fixes the only complaint about radars.
Three ways teams use it.
Feature comparison: us vs competitor across attributes.
Team capability radar across competencies.
Account fit score across criteria.
Add it in 30 seconds.
Open your Data Studio report and click Add a chart → Community visualizations → Explore more.
Paste the Viz Studio manifest URL or pick this chart from the Viz Studio gallery card.
Bind the dimensions and metrics in the data panel. Done.
More from Tables, Calendars & Combo
All 75+ charts →Full calendar grid: event volume painted across every cell.
Compact monthly calendar: one cell, one number, instant pattern.
Day-of-week × hour heatmap: when your audience actually shows up.
Row over row: DoD / MoM / YoY comparison table with deltas and % change.
Included in your vizstudio plan.
One plan, everything in it: the full library of 75+ charts. No per-seat upcharges, no metering. Build a real dashboard before you pay a cent.
Start free →