Interactive 3D Globe
Real country polygons, drag-to-rotate, auto-spin, atmosphere glow, the 3D world your dashboard actually needs.
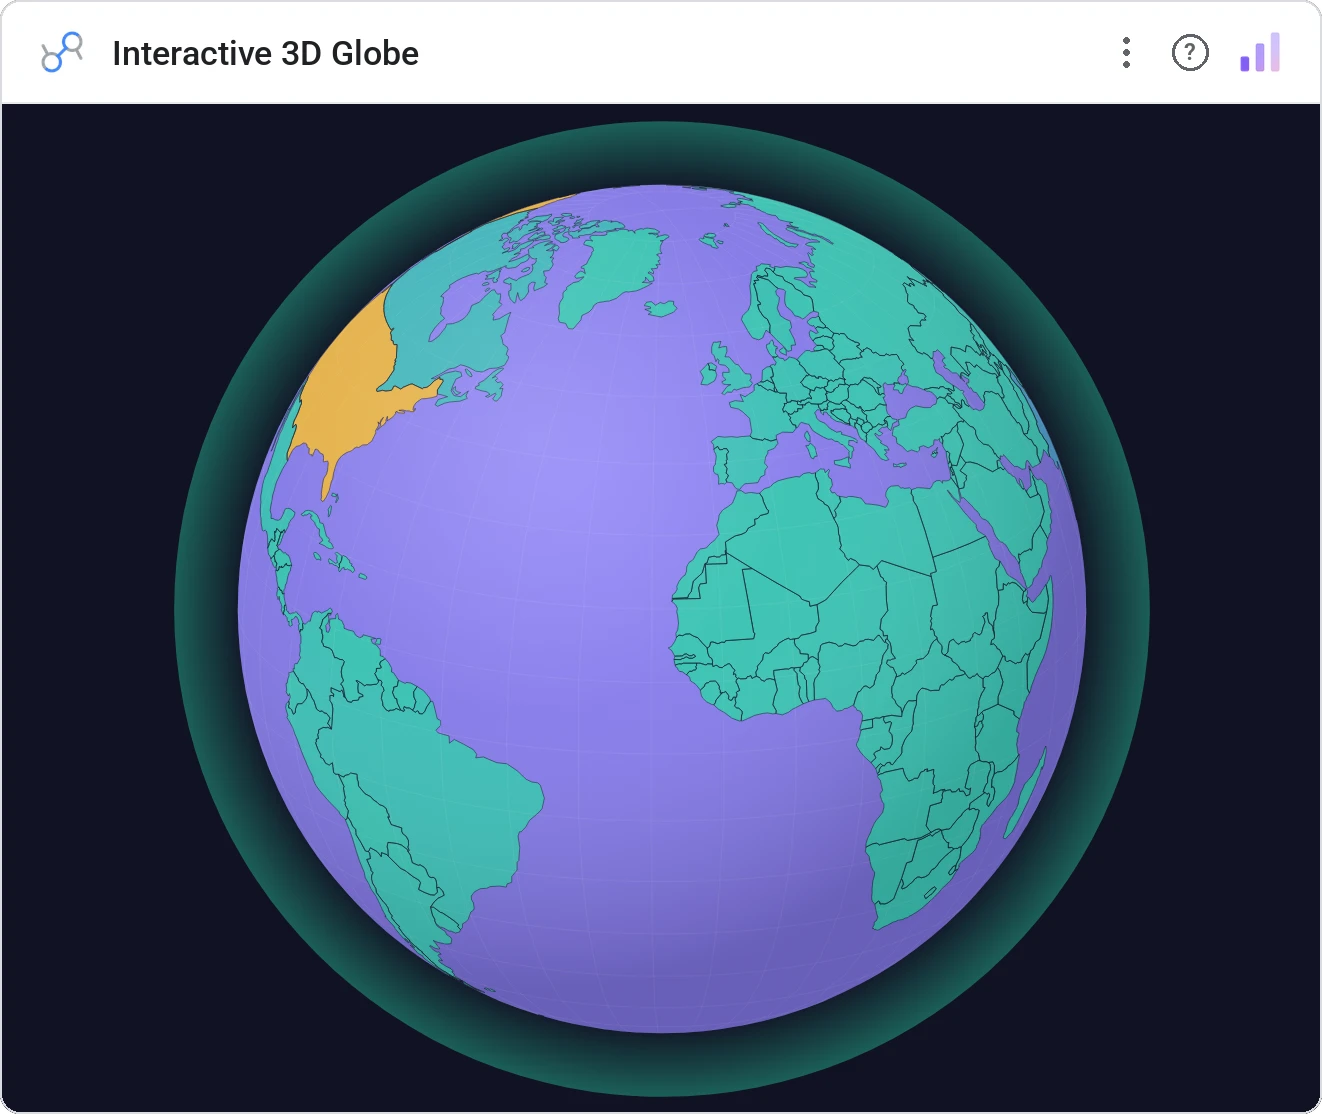
SVG-based interactive 3D orthographic globe with real country polygons (Natural Earth 110m), drag-to-rotate, auto-spin animation, zoom, choropleth color scale, atmosphere glow, graticule grid, tooltips, country labels, cross-filtering, and full style customization. 1 country dimension (ISO-3/ISO-2/name/numeric), 1 metric.
Renders the world as an interactive SVG orthographic projection using Natural Earth 110m country polygons. Drag to rotate, scroll to zoom, optional auto-spin. Cells colored by your metric, with atmosphere glow, graticule grid, country labels, hover tooltips, and click cross-filtering.
Flat maps distort. A real-polygon globe with atmosphere and graticule lines is a presentation-grade view, and it cross-filters the rest of the report on click.
Three ways teams use it.
Revenue per country with the globe spinning in the lobby.
Indicator across regions in an executive summary.
Booking volume per country with tooltip detail.
Add it in 30 seconds.
Open your Data Studio report and click Add a chart → Community visualizations → Explore more.
Paste the Viz Studio manifest URL or pick this chart from the Viz Studio gallery card.
Bind the dimensions and metrics in the data panel. Done.
Included in your vizstudio plan.
One plan, everything in it: the full library of 75+ charts. No per-seat upcharges, no metering. Build a real dashboard before you pay a cent.
Start free →